Monitoring the
condition of your CommCell is extremely important in protecting and maintaining
the integrity of your data. To monitor your CommCell, you can configure global or
job-based alerts, which, when triggered, send notifications of specific conditions,
some of which may be critical occurrences that require immediate attention. Monitoring
an extremely large CommCell or many CommCells can be a daunting task, possibly a
task better suited for a third-party, be it internal to your organization or external.
This monitoring can be easily implemented with the ROMS® Service.
ROMS® is a separately purchased
Bull software component that works with your CommServe to monitor
CommCell operations. ROMS® uses configured alerts to inform ROMS® users of conditions
occurring within a CommCell that may have otherwise gone undetected. With this,
ROMS® users are easily able to monitor the CommCell without accessing the CommCell
itself.
The ROMS® software consists of three components:
The ROMS Listener:
The listener is installed on the monitored CommServe. It provides a lightweight mechanism
for monitoring the CommCell's configured alerts and provides instructions between
the monitored CommCell and the ROMS® Webservice. When a monitored alert is received,
the ROMS® Listener is triggered to encrypt and forward the received alert to
the ROMS Webservice.
The ROMS Webservice:
The Webservice, hosted at Bull,
receives and processes received alerts through an SSL connection between each monitored
CommCell and the ROMS® Database. The ROMS® Webservice is the triage point for
processing inbound alerts and outbound instructions per each customer’s desired
monitoring level as maintained within the ROMS Database.
The ROMS Database:
The ROMS® Database
houses each customer’s preferred monitoring level on a per server basis. Based
on the ROMS® configuration selected by each monitored customer, the ROMS® database
processes act on alerts received from the ROMS® Webservice to correlate actions
associated with each alert. The ROMS® Database also maintains performance and
history information associated with each monitored CommServe.
To monitor the
CommCell(s), ROMS® users will access a Customer Dashboard through Bull’s
Maintenance Advantage eSupport portal, a friendly user-interface that displays the
conditions of the CommCell.
ROMS®
monitoring can be easily implemented. During the installation of the CommServe
software, the ROMS® Agent is automatically installed, leaving it only
to be enabled from the CommCell Console. Once enabled, users can access the
dashboard URL to monitor the CommCell(s) condition. To ensure connection to the
ROMS webservice, prior to enabling the ROMS agent please confirm the following
steps are completed:
Firewall Port 443 open to IP Address 199.255.244.116 roms.commvault.com
Entrust certificates imported (see note below for certificates)
Alert is a configurable tool that is part of the Common Technology Engine
Architecture. Alerts are used by ROMS® to inform the users of conditions
occurring within a CommCell that may have otherwise gone undetected. These
conditions range from minor occurrences that do not require immediate
intervention to severe occurrences that impact data operations and require a
trouble report. The Alert system detects these conditions within two minutes of
the occurrence. ROMS® Alert are configured by the ROMS® Webservice and are
job-based.
Alert Processing
Alerts generated in a monitored CommCell are passed to the ROMS Webservice.
The Webservice processes the alert by determining if it is associated with a
monitored or unmonitored server. Monitored system alerts are passed to the ROMS
Database for further action. Unmonitored system Alert are accumulated but not
acted on. Based on the Service Level Agreement (SLA) associated with the server
for which the alert was received, the ROMS Database dictates actions associated
with processing of the alert. Each processed alert is accumulated on the ROMS
Customer Dashboard and the ROMS Network Operations Center (NOC) Monitoring system. Once an
alert is
processed as Tagged by either the ROMS customer or the ROMS NOC, the alert is
removed from the ROMS Customer and NOC dashboards.
Alert Tagging
Alert tagging is completed by the ROMS NOC based on the tasks required to
fully process the alert as governed by each monitored server’s SLA or by the
customer in the event that an alert is triggered for otherwise benign reasons
(example: System add or change that interrupts a Data Management, Access, or
Protection operation). Tagging an alert removes the alert from the ROMS
dashboard and closes any additional action associated with the alert.
Licenses are not required
on the CommServe for ROMS activation; however, the ROMS software requires registered
licenses in order for monitoring and reporting to occur. Monitoring levels are dependant
on the license type purchased – refer to http://www.bull-calypso.com/advantage for more information
regarding monitoring service levels. Please contact your software provider's
customer support representative for details regarding ROMS licensing. You will need
to provide the details of the CommServe that will be monitored by ROMS; it will
be included in the ROMS Licensing Agreement. Furthermore, be sure to obtain your
user account credentials to access the Customer Dashboard.
This section describes how to enable and configure ROMS Monitoring with your
CommCell.
To enable and configure ROMS:
1.
From the CommCell Console, navigate to the Tools
menu and select Control Panel.
2.
From the Control Panel, select ROMS Configuration.
3.
Once
enabled, ROMS is ready to transmit alert and rule information to the
ROMS webservice. To send CommServe alert messages to the ROMS webservice,
select Send Alert Messages.
You can specify
the intervals at which the system check should occur using the Heartbeat
Interval.
It is not recommended to set the heartbeat
interval to less than 15 minutes unless specific connection
requirements prescribe a more frequent connection. Contact
Customer Support if design requirements prescribe a more
frequent heartbeat connection.
This section describes how to access the ROMS Customer Dashboard.
1.
Navigate to the URL for the ROMS Customer Dashboard Web
Site, and enter your Maintenance Advantage user account credentials; you should have received this
information when you purchased the ROMS licenses.
Click Login.
2.
The ROMS Customer Dashboard is launched.
Click the
ROMS Quick Start Guide link to access setup and configuration
information for ROMS Customer Dashboard.
The Servers and ROMS Servers display indicates the number of servers in the
monitored CommCell in total and the number of servers that ROMS is currently
monitoring. Each number refers to a physical / logical installation of a server.
Both physical and virtual servers are designated as servers in this count.
Server clusters are represented as two (or more) physical nodes, rather than the
clustered server name.
The Refresh Time field is a user-configurable setting that
indicates the time at which performance metrics are gathered.
The time specified in this field is local time for the ROMS
administrator.
The ROMS heartbeat is a continuous connection between the ROMS CommServe and
the ROMS Webservice. This connection is refreshed every fifteen minutes. The
status of the connection between the ROMS CommCell and Webservice is noted by
the red/green light at the top right of the ROMS Customer Dashboard. A
green light indicates a live connection status as of the fifteen minute refresh
cycle. The amount of time that the connection between the ROMS CommServe and
ROMS Webservice is incremented in hours and noted as “ROMS server online for XXX
hours”. The ROMS Heartbeat serves two purposes:
Demonstrating connectivity between monitored customers and the ROMS NOC. As
the Listener is a passive process, the ROMS CommCell only transmits to the
Webservice in the event of an alert. In order to ensure that a lack of
transmitted alerts is a desired state, rather than due to a loss of connection
to the CommServe or the loss of the CommServe itself, the ROMS Heartbeat
verifies ongoing connection between the ROMS monitored CommCell and the ROMS
Webservice.
The ROMS heartbeat enables instructions to be passed between the ROMS Webservice and monitored CommServes. If an instruction is placed into the ROMS
database as part of the alert tagging process for example, gather logs associated
with an alert in order to open a trouble report, the ROMS Webservice passes the
instruction to the CommCell in order to complete the requested task. Another
example of a process completed by the ROMS heartbeat is the collection of ROMS
reports associated with CommCell activity on a daily/weekly/monthly basis.
ROMS monitoring activity between monitored CommServes and the ROMS Webservice
may be temporarily suspended by the ROMS administrator in order to perform a
CommCell IMAC (installation, move, add, change) within the CommCell that would
otherwise create multiple alerts.
It is important to start ROMS monitoring
following the IMAC event as during the ROMS Pause no alerts are passed between
the monitored CommServe and the ROMS Webservice.
Clicking the Log Off button
exits
the ROMS Customer Dashboard but does not end the Maintenance Advantage session.
This allows the ROMS administrator / reviewer to continue to access information
within Maintenance Advantage after ending the dashboard web session
There are three levels of service associated with ROMS monitoring
Gold: System monitoring, reporting, and knowledge base/alert integration.
Platinum: Adds live review of alerts / trouble report creation if warranted by
the received alert.
Diamond: Adds immediate contact on receipt of an alert to
the ROMS customer through the call precedence list as established by the customer
ROMS manager. Warm transfer of alert to Bull support, if necessary, is
included in this SLA.
The ROMS alert boxes provide a
summarized display for the ROMS reviewer /
administrator to focus attention to new and in-process alert. The Alert Summary
panel provides three ways to view your alerts.
The Alert Summary View shows all open and in-process alerts across all SLAs.
The Alert History by Client and Alert Trend Analysis links focus on
displaying historical data about alerts to help you manage your environment and
licenses in the most efficient way.
The SLA specific panels allow for a per
server SLA view into alerts.
The stoplight theme enables an immediate lookup
capability into each SLA view in order to allow for the triage of any alerts by
order of precedence or system importance.
The stoplights are linked to the ROMS
database and indicate the following alert status based on stoplight colors:
Green: No alerts for the Service Level Agreement-enabled servers
Yellow: Alerts received for the Service Level Agreement-enabled servers.
These alerts have an alert severity of either minor or major.
Red: Alerts received for the Service Level Agreement-enabled servers.
These are critical alerts. Additionally, alerts in this category may contain
information about a modification to the ROMS service on the CommServe that
will interrupt monitoring for the CommCell.
Unmonitored alerts are provided to assist administrators with decisions
regarding allocating ROMS monitoring licenses between servers. This area of the
dashboard tracks alerts received by the ROMS Webservice by system name and date.
Selecting the link “Click here to see affected systems” opens a separate
screen indicating the following:
Names of affected systems
Number of unmonitored
alerts received for those systems
The most recent dates for which those
systems have reported alerts
Using this feature, the ROMS administrator is able
to determine if ROMS monitoring should be moved between servers in order to
capture alerts associated with problematic servers.
Alert history is a collection of all alerts associated with the selected
CommCell. This section of the dashboard is used to view all received alerts that
have not been tagged by either the customer or the ROMS NOC. Alert history may
be sorted by Job ID, ROMS client server name, iDataAgent
type, Service Level Agreement type, date / time received for each alert, failure
reason, or the ascending / descending number of alerts.
Additionally, this detail may be exported to an excel spreadsheet for
additional sorting and reporting. Filters are enabled on this page to allow date
range relevant searches for open alerts. Information presented in the alerts
history page is intended to provide the ROMS Administrator / reviewer with the
ability to rapidly sort alerts under any context in order to identify areas of
concern within the ROMS-managed CommCell.
Based on its organization by SLA, stoplight-based alert access allows for a
simplified means of accessing information, and sorting alert details within that
SLA. Stoplighting is generally used as the first point of entry in reviewing
alerts. Note, however, that stoplighting is a captured alert set and the
reviewer / administrator is unable to view alerts outside the selected SLA or
any alerts that are in process. You must use the Alert Summary View to see
alerts that are in process and all alerts regardless of SLA.
This section of the dashboard contains support-relevant details associated
with any ROMS monitored CommServe associated with a customer’s enterprise.
Each
ROMS-enabled CommServe is visible through the drop down selection option located
in this section of the dashboard. By selecting a CommServe, the application and
service pack version associated with the selected CommCell is displayed.
This
selection process serves to update the entirety of the ROMS dashboard within
information relevant to the selected system. In addition to base configuration
information for the CommServe; CommCell ID, Bull software
installed; any critical updates associated with the CommCell that have been
released but not applied are listed in the Missing Patches field located
on the CommCell View page.
Also, if you have purchased a Capacity License, your
Capacity License usage information will be displayed here. For a description of
Enterprise and Core Capacity License agreements, see
License Usage by
Capacity.
This performance indicator is based on the aggregation of all jobs within the
past 24 hours that are written to magnetic library storage. Each job is
accumulated based on the amount of data movement divided by the amount of time
for each job to complete. These statistics are then averaged to provide an
average performance specification for all writes to the total volume of magnetic
library storage associated with the CommCell.
This performance indicator is based on an odometer – detailing the amount of
data moved / protected within a 24 hour period of time at the point in time in
which the ROMS dashboard is accessed. This figure is determined through the
aggregation of all successful jobs within that 24 hour period.
This separately accessible page within the dashboard provides the same level
of information regarding the application version/service pack/missing
patches as the CommCell configuration page does for the CommServe. Information
on this page captures the entire CommCell from the CommServe (top) to each
storage target (bottom). This detail is useful in determining any mismatches
associated with service packs for each MediaAgent in the CommCell.
MediaAgents with a green indicator are monitored by ROMS and are online;
red indicators are monitored and are offline; and yellow indicators are for
MediaAgents that are not monitored by ROMS.
MediaAgent, library, and drive types in your environment are displayed
in grids.
You can click on library or drive type to see detailed information about each device.
Selecting a library displays
performance and reliability information, such as the amount of data
written, the efficiency percentage, and number of errors. Selecting a
drive type displays the error count for each drive.
This is a summary of all CommCell jobs completed within the last 24 hours. To
see detailed information about all jobs in each status, click on a section of the
chart or a job status in the legend.
The following job statuses are tracked:
Successful
Partial Success
Failed
Killed
Skipped
Failed to Start
When you select a chart section or job status, detailed information,
such as agent name, storage policy, and last backup time, for all jobs
in that status appear in a table. You can switch between status types by
selecting another status from the Job Status list.
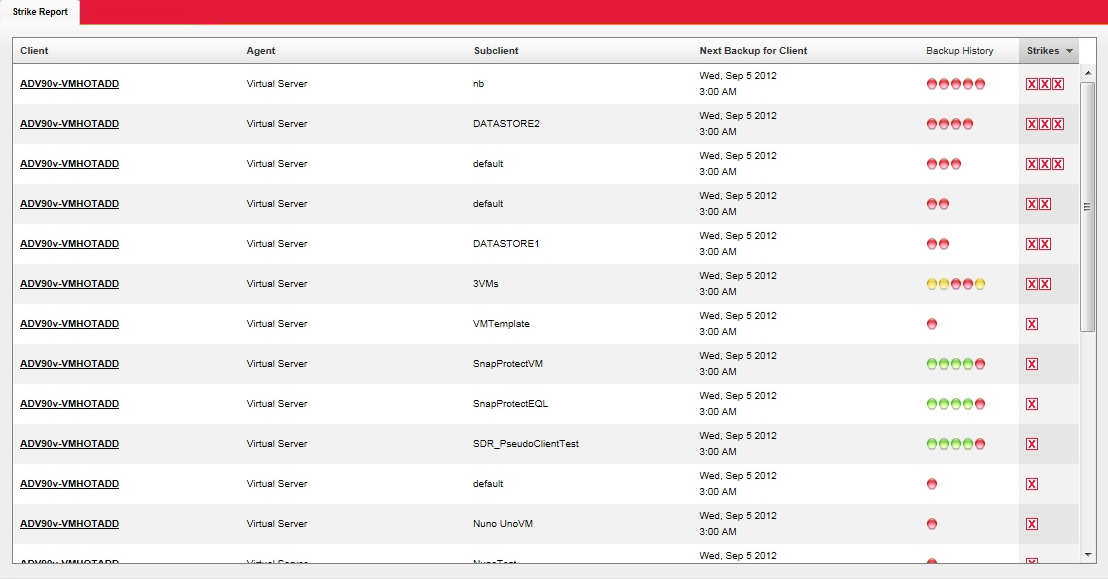
The Strike Report helps to quickly identify subclients with consistent
backup failures. The report includes information for subclients that
contain 3 or more failed backups out of the last 5 backups or over the
last 30 days. Scheduled backup jobs that failed to run are counted as
failed and included in the report.
To access the Full Strike Report, click Full Strike Report. This
report displays all subclients that contain one or more failed backups
out of the last 5 backups or over the last 30 days, whichever comes
first. Green indicates a successful backup, red indicates a failed
backup, and yellow indicates a partially successful backup.
The Licenses tab of the ROMS Manager displays a lists of all the active
and permanent licenses installed within the CommCell.
This summary listing
of active licenses may be used as a quick reference for reviewing active CommCell licenses to determine any gaps in coverage between the CommCell
server environment and the Data Center server farm.
The New Features section displays a list of all
recent updates to the ROMS Customer Dashboard as an outline..
These enhancements are part of the ROMS
continuous product improvement process. and reflect customer and partner
suggestions. Customers are able to provide ROMS feedback through the
link in this tab.
For more information about updates to ROMS, see the
ROMS New
Features blog.
ROMS Manage Monitors is used by the ROMS administrator to review all of the
servers within the ROMS monitored CommCell. The Manage Monitors page provides
the following views and capabilities:
Client Name
Service Level
Email Alerts Off Hours: The regular monitoring hours are from 8am -8pm
CommServe time. Use this filter to set alert times in case you want to be
alerted after the monitored time. Alert emails will be sent during off hours
though the alert would not be monitored by the NOC.
Maintenance Window: Use this filter to set time to stop monitoring
alerts for running maintenance jobs for particular client..
Alerts: Use this filter to display the unlicensed client
Each server that is visible to the CommServe is listed in this view. It
includes the registered name of each server in the CommCell and the active
agents installed on each server.
This view is useful for any administrator / reviewer accessing the page as a
means for reviewing license usage per host within the CommCell. It also outlines
which servers in the monitored CommCell are MediaAgents, as well as the name of
the CommServe. Note that the CommServe has a fixed Service Level Monitoring
status set to Diamond and must be monitored.
It is highly recommended that you monitor your MediaAgents as well, though
not required. MediaAgents must be monitored at the Diamond level if they are
monitored. The list of servers can be filtered to show only servers with a
particular agent installed or show only the MediaAgents through the dropdown
list.
The customer manager role allows for the status to be modified or
de-assigned. The service level monitoring for each server in the CommCell is
dynamic and may be updated by the customer manager based on changing
requirements for monitoring within the CommCell(s) enabled by ROMS.
For example, a pending application migration for a server may be accompanied
by a change in the service level monitoring status for that server from gold to
diamond based on the requirement to increase the level of Bull
support associated with that server during the migration project.
Use the steps given below to complete the service level monitoring::
Select Edit.
From the Service Level list, select service level Status.
Select Update.
A change in service level monitoring status
may be made only if there are sufficient ROMS licenses available
for the desired SLA. The ROMS database continuously tracks the
number of ROMS licenses per SLA available within the CommCell
and provides a listing of all available licenses for a given
SLA. If no licenses associated with a desired SLA are available,
the drop down will not show the specific SLA. The customer
manaher may update the status of an alternate server in the ROMS
monitored CommCell to a different SLA in order to free the
desired license type to be used on the selected system.
The ROMS Manage Users page is used by the ROMS manager to assign roles within
the ROMS monitored CommCell. Manage Users provides a view of all customer
personnel that have access to the ROMS managed CommCell through their
Maintenance Advantage account. From this view the ROMS manager is able to assign
roles within the CommCell to those visible personnel. Each field in this page
view can be filtered to allow for a fast review of roles and rights associated
with access to the ROMS CommCell(s).
Role descriptions associated with allowed actions by ROMS user types are
outlined in the matrix below.
Function/Role
manager
Admin
Reviewer
Notes
View Dashboard
View Alerts
Close Alerts
View CommCell Configuration
Add New Users
Assign Existing ROMS Licenses
Order Additional ROMS Licenses
Modify Service Levels between Servers
Manage Rules
Manage Holidays
Receive Email Notification
If the alert matches a configured rule, the alert will be emailed to
the individuals specified in the rule.
Receive Phone Notification
ROMS User information; name, email address, and phone number, is
extracted from the User’s Maintenance Advantage account. The information
indicated in the Manage Users page is fixed and may only be updated by
updating the base Maintenance Advantage account detail.
Additional information regarding alternate contact numbers, special
instructions to the ROMS NOC team; for example, after “Do not call after
3:00AM local time”; may be added to any selected ROMS user by selecting
the edit option and adding these instructions and notes to the User
Notes field.
The Manage Alert Rules page is used for the following:
Configure all the types of alerts
Assign alert severity to each
type of alert
Click on the Edit link to modify the alert severity
associated with that type of alert.
Setting the alert severity to None
will cause that alert type to be turned off. This can
potentially save you bandwidth and reduce the number of rules you will
need to configure in the Rules Engine, if you know that you do not want
to report on a particular alert type.
If you manage multiple CommCells, you can check the Apply Globally checkbox to apply a change to all CommCells you manage, and you can also match all the
alert configurations
from any of your CommCells to the currently selected one by selecting
from the dropdown and clicking Go.
Enter the number of minutes that you would like to prevent duplicate
alerts from being processed.
Enter the number of minutes that you
would like to prevent email notifications for alerts that are for the
same client, error code, and alert category as an alert that you have
already snoozed.
Both of these settings are designed to prevent you from receiving a
large number of emails about one particular problem. By default, both
time periods are set to 120 minutes.
Setting either time period to 0 will disable the function so that
every alert is processed, including duplicates. You can also set these
values for all CommCells that you are a managing for by checking the
Save Settings Globally checkbox.
Optionally, you can add a custom
subject line and body text for all alert e-mails in the Custom Subject
box. Custom subject lines can be useful for quickly identifying who
should respond to an alert and enabling an automated system that parses
alerts and sends tickets to the correct queue. You can use the buttons
to insert variable text, such as the job ID, into the body of the
e-mail.
Select the date that you would like your Commcell to be monitored other
than weekends.
You can also add or remove holidays from all the
CommCells that you have the manager role for by checking the Add as
Global box next to the date you are adding or removing, then
clicking the Save button.
System rules are checked whenever any alert is sent to ROMS and is not
specific to any particular alert. Once you select the rule you want to apply, you
will be prompted to fill in values for any parameters that the rule
requires.
Alert rules can be created to handle specific alert situations. Once you
select the rule you want to apply, you will be prompted to fill in
values for any parameters that the rule requires.
For example, if you
apply the Detected Criteria Rule then you will be prompted to
enter a string that ROMS should search for in the Detected Criteria
for each alert.
You will also be prompted to select how you would like ROMS to
handle alerts that match the criteria you specified.
When you select an action, you may be prompted to enter
additional parameters, depending on which action you select.
Once you are finished, save the rule and then it will appear in
the list with a description of the rule and the parameters that you
have selected for the rule.
A rule's priority is defined by its order on this list, with the top
being first priority.
If you wish to adjust the priority on a rule, then click the up or
down arrow in the Adjust Priority column for that rule to either
increase or decrease the priority.
Rules are evaluated in the order they appear on the page, and by
default once a match is found for an alert then the rules engine will
stop evaluating rules. However, each rule has a Continue Processing
on Match parameter that if set to True instructs the engine
to keep looking for additional rules to apply after it finishes
processing the current rule.
Rules can be edited or deleted by clicking the appropriate link in
the last column of each rule. Changes to rule priorities happen in real
time as you make them, so there is no need to save after making changes.
The Global Comparison tab allows you to see how your CommCell is performing
relative to other CommCells in the ROMS universe. You can see your job
performance, auxiliary copy performance, and drive performance at a high level,
with the option of drilling into each metric to see more detail. For
instructions on what metrics are available and how to use the interface, see
Global
Comparative Metrics.
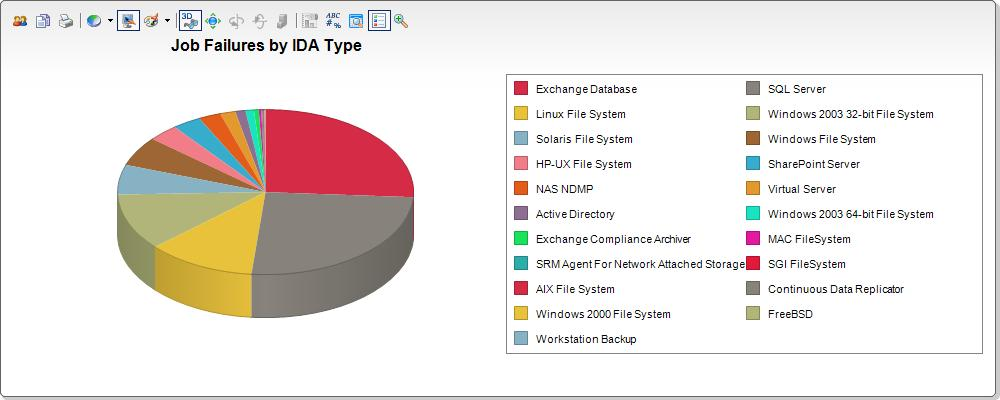
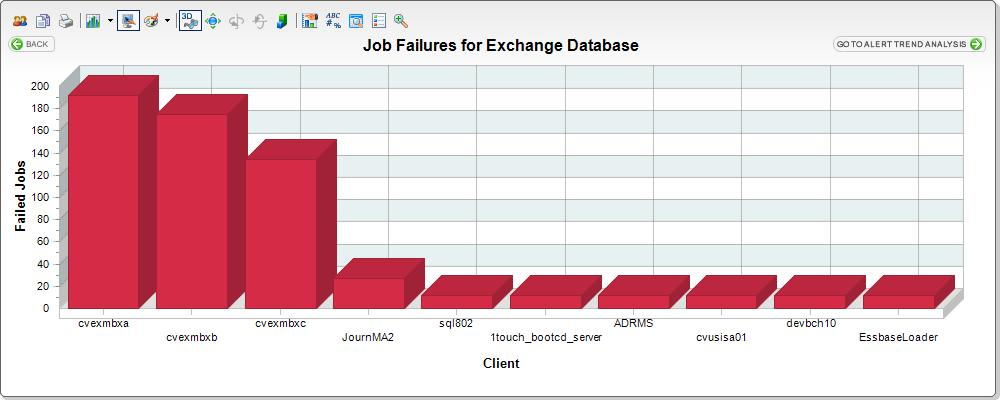
This metric shows the job success rate for your CommCell compared to the
worldwide average.
When you click the Details link, a report
that shows your job failures broken out by iDA agent appears.
When you select a chart section or agent, a report for the selected
agent appears. Information in this report includes the number of failed jobs per client for that
agent.
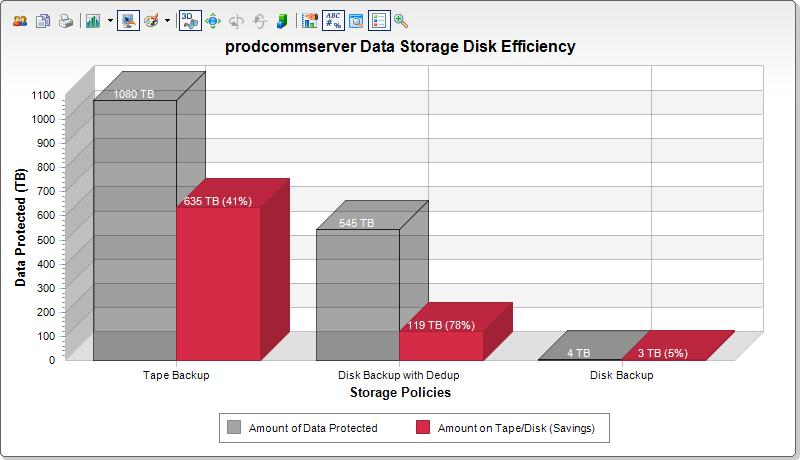
This metric shows the disk savings you are achieving for your
Deduplication storage policies compared to the worldwide average. This
metric is only available for version 9 CommCells.
When you click Details, a report that shows the data
storage efficiency broken out for tape backup, disk backup with
deduplication, and disk backup without deduplication appears. The chart
shows the size of the application, the storage space actually used, and
the percentage savings you are achieving in each category.
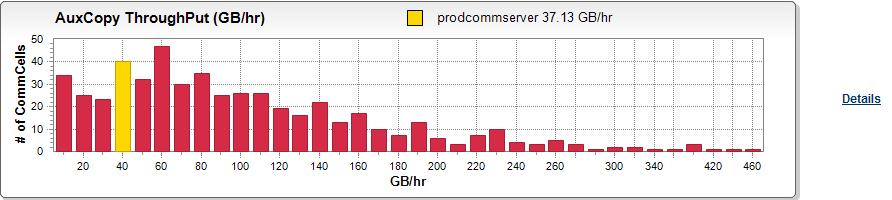
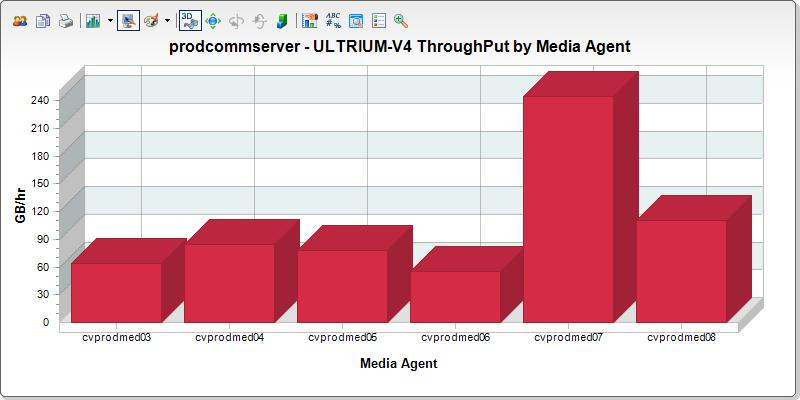
This metric shows a histogram of the throughput in gigabytes per hour for
auxiliary copy operations. Your CommCell throughput is indicated with
the gold color in the chart.
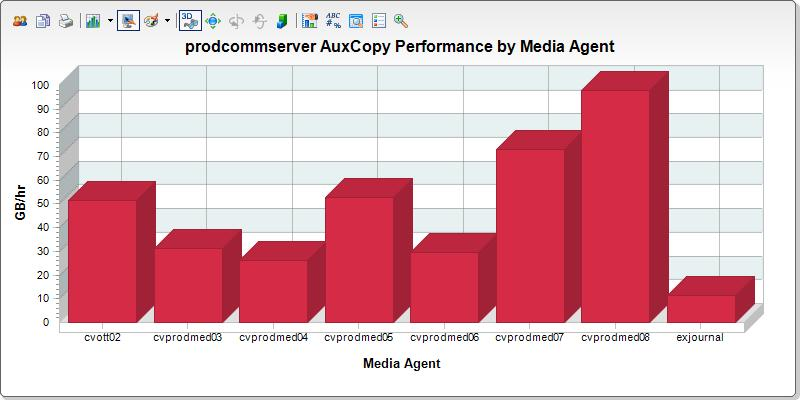
When you click Details, a report that breaks down your throughput
by individual media agent appears. This report can help you to identify
bottlenecks or inefficiencies in your environment.
This metric shows one gauge for each tape drive type in your
environment, showing you the rated throughput of the drive, the median
throughput that other customers are getting, and the throughput you are
getting in your environment for that drive type.
When you click Details next to a drive type, a report that breaks
down the
throughput by media agent appears. This report can help you to identify bottlenecks or
inefficiencies in your environment.
This metric shows the latest service pack available for your version,
which service pack you have installed, and the percentage of ROMS
customers that have upgraded to the most recent service pack.
The CommCell Trends tab displays statistics for CommCell performance.
You can use this chart to quickly identify areas with problems or
performance decline. Information includes the amount of data protected,
number of successful backups, and the success rate. You can customize
the time period for which information is displayed by changing the Start
Date and End Date. Click Update Analytics to refresh the chart
information.
Additional reports on the CommCell Trends tab include Throughput Statistics and
Application Size.
Throughput Statistics displays job throughput size
for disk and tape over the last few weeks. MediaAgents that fall below
the median throughput rate for the last week appear below the chart.
This information can help you to monitor backup job performance and act
to resolve related problems.
The Application Size report displays the overall size of backup
application data compared to the actual amount of data that is consumed
by backups. This report displays overall environment growth over several
weeks. Statistics are collected every Tuesday. This information can help
you to monitor the size of data on media versus the size of backup data.
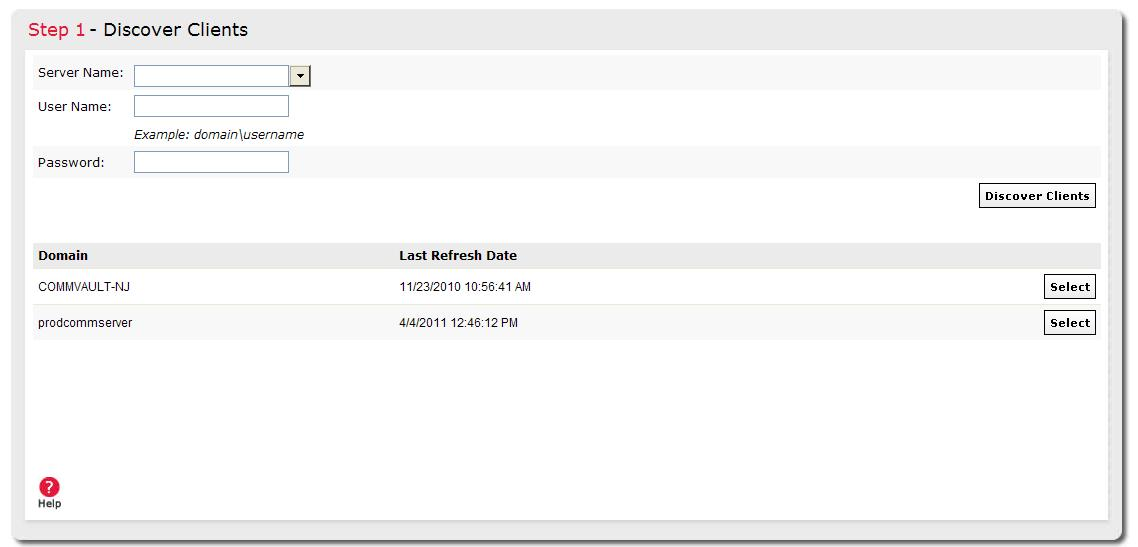
The Installations tab displays the status of installations in progress and
allows you to start a new software installation. Using the Installations wizard,
you can discover domains, and then install software remotely to a number of
clients, even if you do not have direct access to the CommCell.
If you choose to start a new
installation, you can either pick clients from an already discovered
domain, discover a new domain, or refresh a domain that you have
previously discovered.
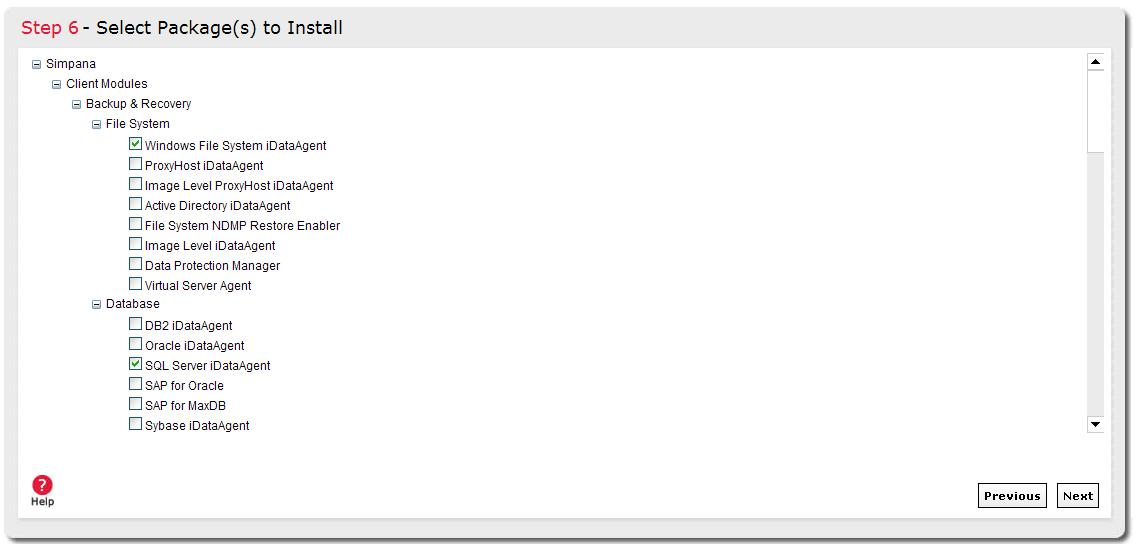
Once the clients have been discovered, simply follow the wizard through
the installation process exactly as you would when installing the
software locally. Choose the packages you want to install on the clients
that you selected.
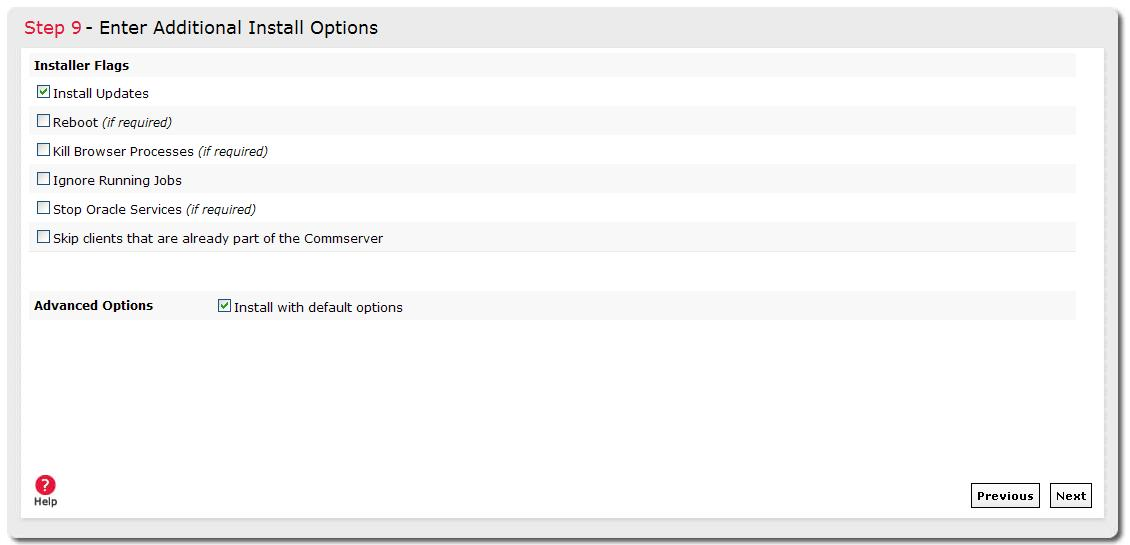
Continue through the wizard, choosing client groups, storage policies,
and options that you want to install on the selected clients.