

| About | Example |
|
Scheduling and Saving a Report
Customizations That You Can Perform With This Report
Data Protection Subclient Detail Report
CommCell Agent Growth Detail Report
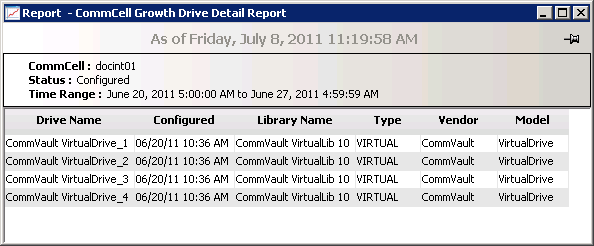
CommCell Growth Drive Detail Report
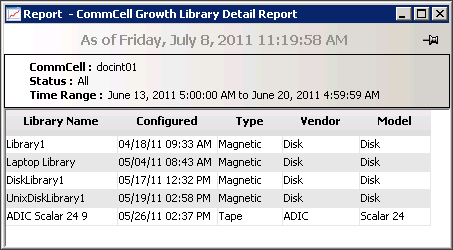
CommCell Growth Library Detail Report
The CommCell Data Growth report is divided into five sub-reports which display the total number of:
Use this report to track and analyze the growth and deployment timeline of one of the above components.
Each sub-report displays the data in the following sections:
| Sub-Reports | Sections | Description |
| Data Protection Jobs | Data Protection Job Growth Chart | The chart displays the number of backup jobs that completed over a specified period of time for a CommCell. Pending, running or suspended backup jobs are not counted. |
| Data Protection Job Growth Table | The table provides the same information as in the chart. | |
| Subclients | Subclient Growth Chart | The chart displays the number of subclients that were created and deleted over a specified period of time for a CommCell. |
| Subclient Growth Table | The table provides the same information as in the chart. | |
| Agents | Agent(s) Growth Chart | The chart displays the number of agents that were installed and uninstalled over a specified period of time for a CommCell. If there are no subclients associated with an agent, the report will not count it. |
| Agent(s) Growth Table | The table provides the same information as in the chart. | |
| Drives | Drive(s) Growth Chart | The chart displays the number of drives that were configured and deconfigured over a specified period of time for a CommCell. |
| Drive(s) Growth Table | The table provides the same information as in the chart. | |
| Libraries | Library(s) Growth Chart | The chart displays the number of libraries that were configured and deconfigured over a specified period of time for a CommCell. |
| Library(s) Growth Table | The table provides the same information as in the chart. |
| 1. |
|
 |
| 2. |
|
 |
|
After a report is generated, you can schedule a new report and save it
to an specific location as a PDF, excel spreadsheet or MHTML file.
Scheduling and saving reports will help you analyze and compare data
from your CommCells. Follow the steps below to create a schedule:
The report will be generated as specified in the schedule task. |
 |
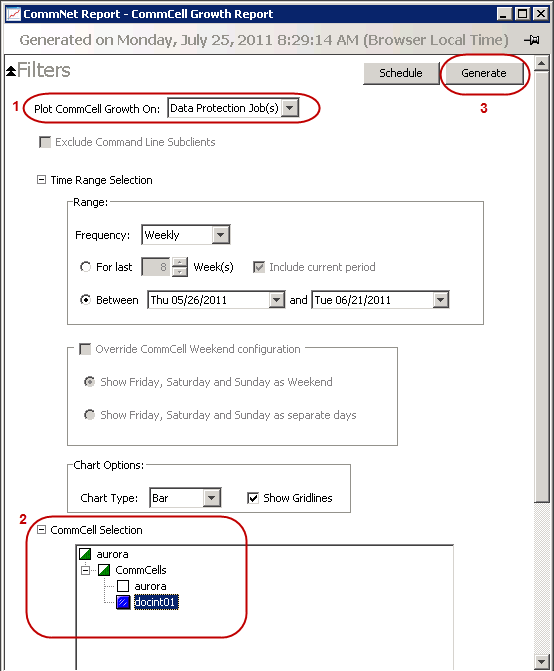
| You can further customize the report by using the filters available in the report. To access the filter options, click Filters at the top of the report window as shown in the image. After making your selections, click Generate to update the report. |
 |
The following table describes the available filter options.
| Filter | Description |
| Plot CommCell Growth On |
By default, the report plots the growth of backup jobs for the selected
CommCells. You can choose to plot the CommCell growth on:
|
| Exclude Command Line Subclients |
By default, the report excludes subclients that were created using the command
line interface. You can choose to include this information by clearing this
option.
This option becomes available when you select to plot the CommCell growth on subclients. |
| Time Range Selection |
You can adjust the reporting period by selecting the
Frequency drop-down list. Based on the selected frequency, you can also:
|
| Override CommCell Weekend configuration |
By default, the report treats Friday, Saturday and Sunday as the WeekEnd
category.
You can list weekend days separately by selecting Show Friday, Saturday and Sunday as separate days.
This option becomes available when you select to plot the CommCell growth on backup jobs. |
| Chart Options | By default, the chart displays stacking bars with gridlines. You can change the chart display from the Chart Type drop-down list. |
| CommCell Selection | You can refine your cell selection by expanding the CommCells node and selecting another CommCell. |
The following reports are not considered primary reports as they derive from the CommCell Growth report.
|
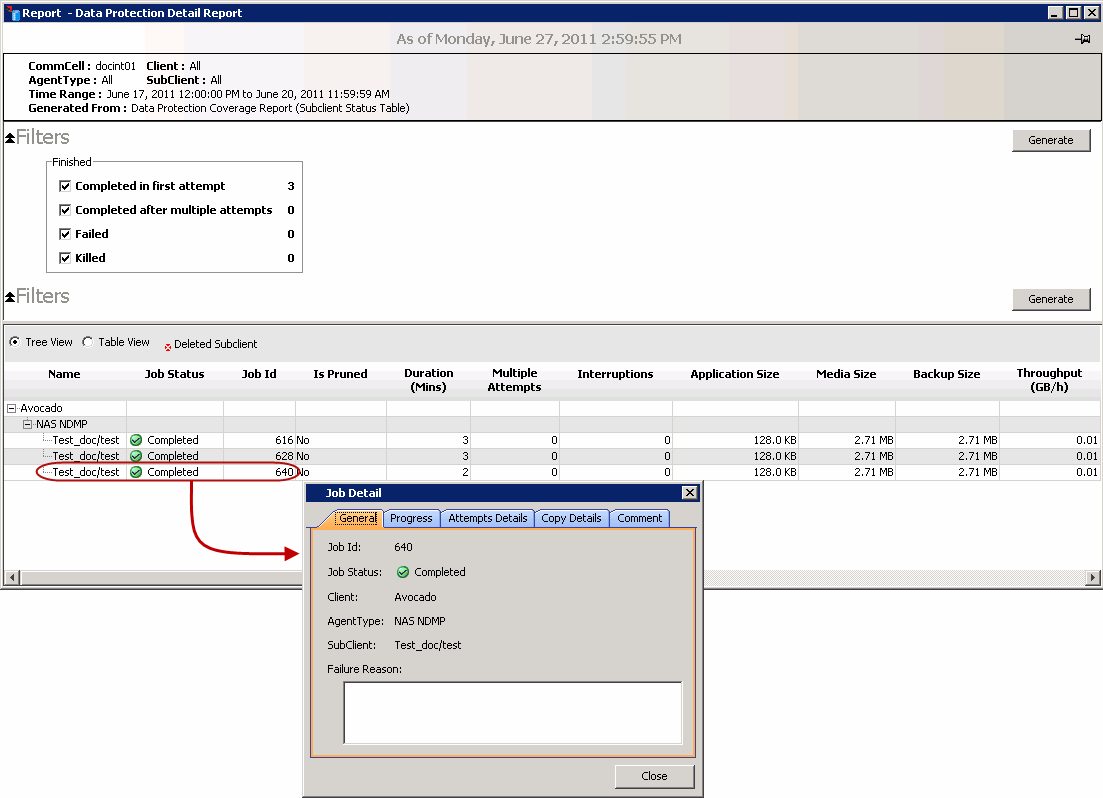
This report provides a comprehensive list of all the backup operations for
a given date. You can access this report by clicking an active bar/grid from the
graphs in the main report. You can customize this report in the following ways:
If you require further information on a particular backup job, double-click the job from the list to access the Job Detail dialog box. |
 |
|
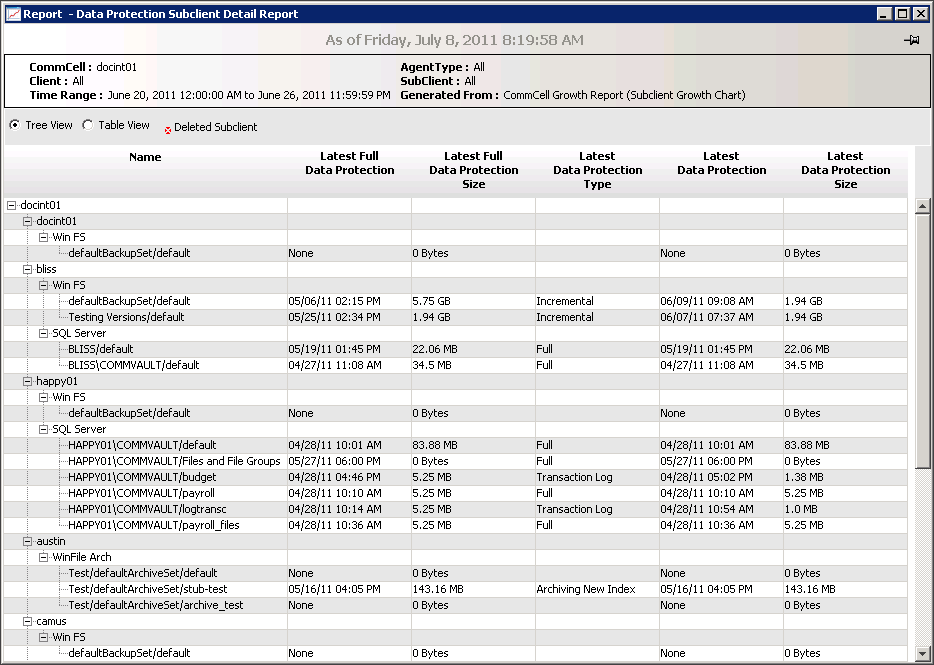
This report includes information on the date, time, size and type of the
latest backup operations for all subclients in the selected CommCell. You can access this report by clicking a bar from the Subclient Growth
Chart or a grid from the Subclient Growth Table. You can also customize this report by changing the default tree view of the listed jobs to a Table View. |
 |
|
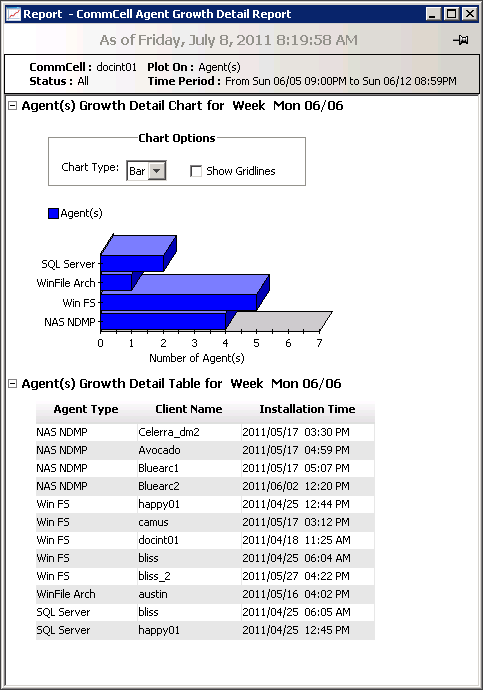
This report displays the agent growth per application type over a
specified period of time e.g., the number of Windows File System iDataAgents
installed in the selected CommCell.
You can access this report by clicking a bar from the Agent Growth Chart or a grid from the Agent Growth Table. |
 |
This report provides additional information for the configured/deconfigured
drives, such as:
You can access this report by clicking a bar from the Drive Growth Chart or a grid from the Drive Growth Table. |
 |
This report provides additional information for the configured/deconfigured
libraries, such as:
You can access this report by clicking a bar from the Library Growth Chart or a grid from the Library Growth Table. |
 |
|
|