The following sections describe the SRM Windows File System reporting features in more detail.
The following features are provided by SRM Reports.
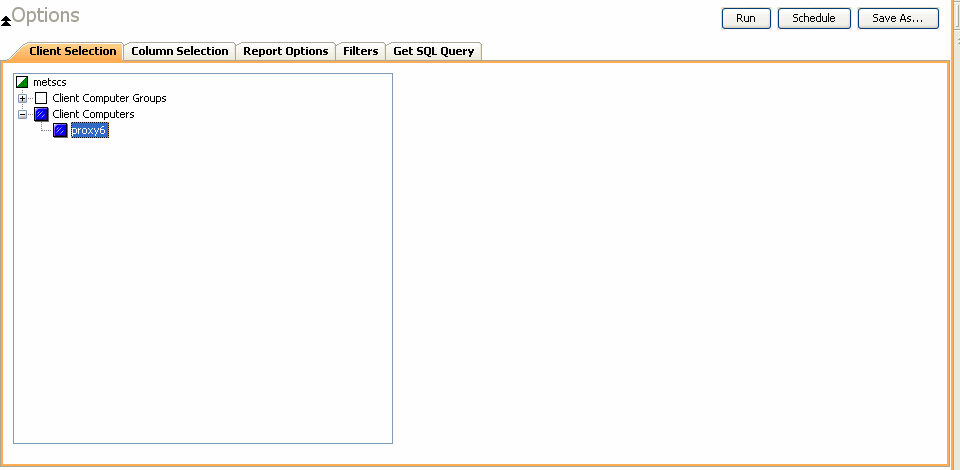
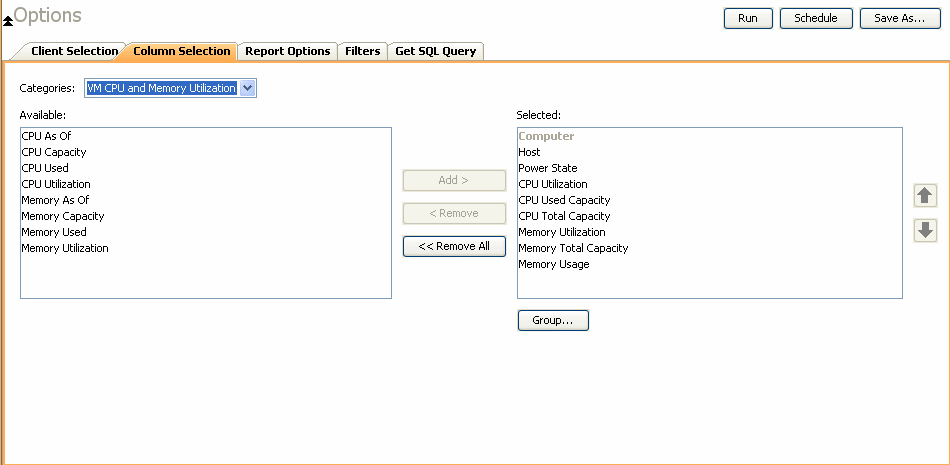
Out-of-the box templates provide pre-selected columns and can be run immediately
after selecting clients or client computer groups. To generate a customized
report, you can start with a template and then alter the pre-selected columns by
adding or removing the columns. Note that when selecting clients, SRM data
collection must be enabled and a full backup needs to have run for the Agent in order to have
up-to-date information presented in the report.
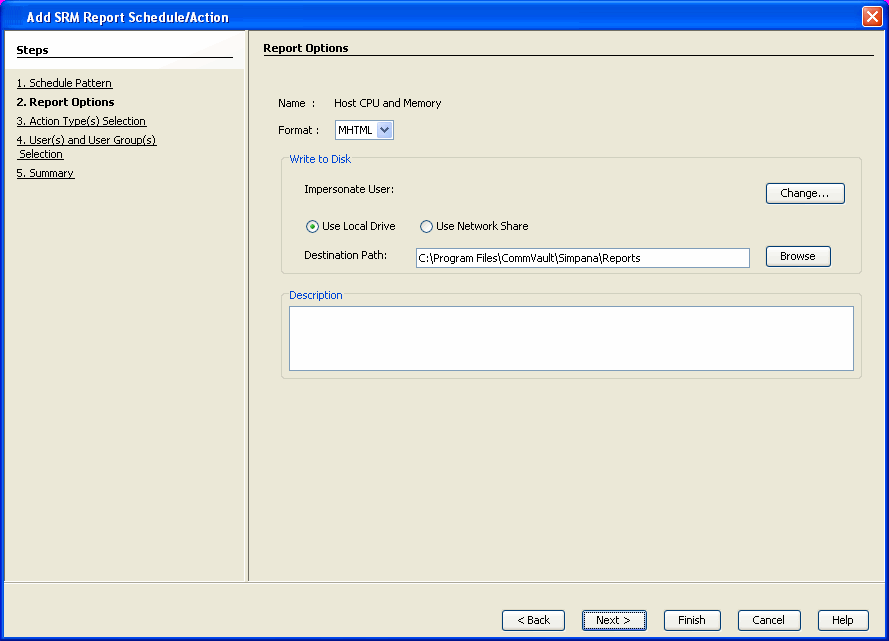
The report options control how data is presented in the report. Either accept
the defaults or modify the options as described below.
For the columns selected, Filters can also
be applied to further refine the data in the report.
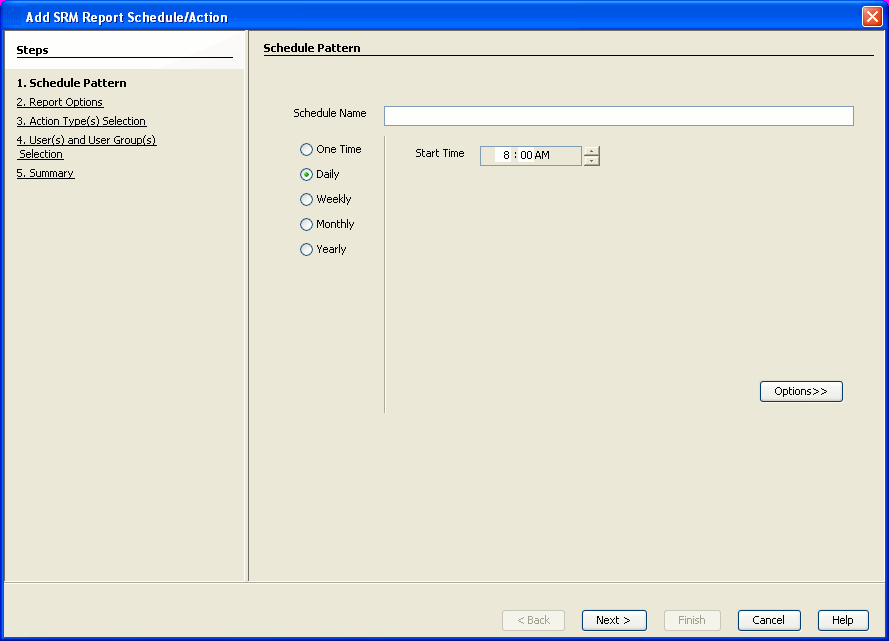
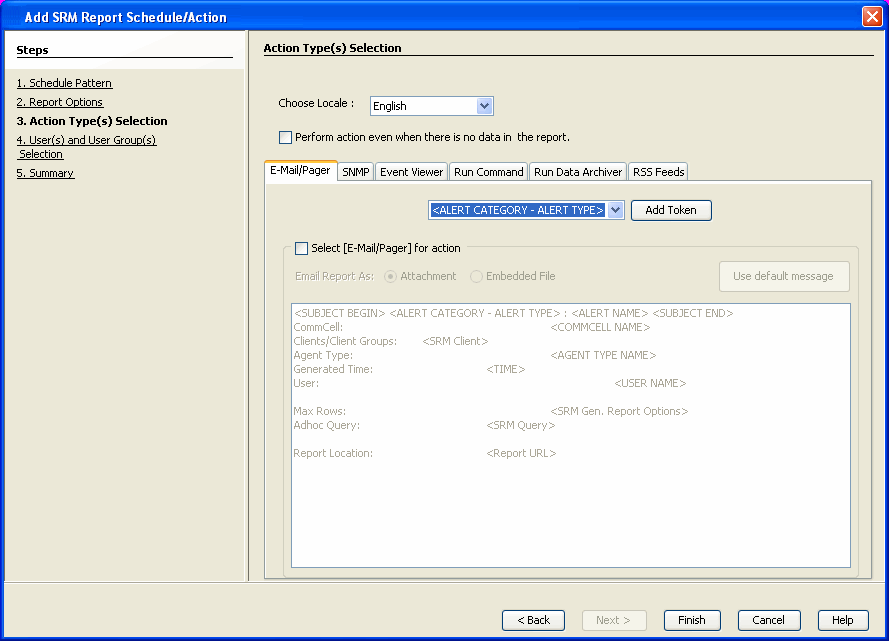
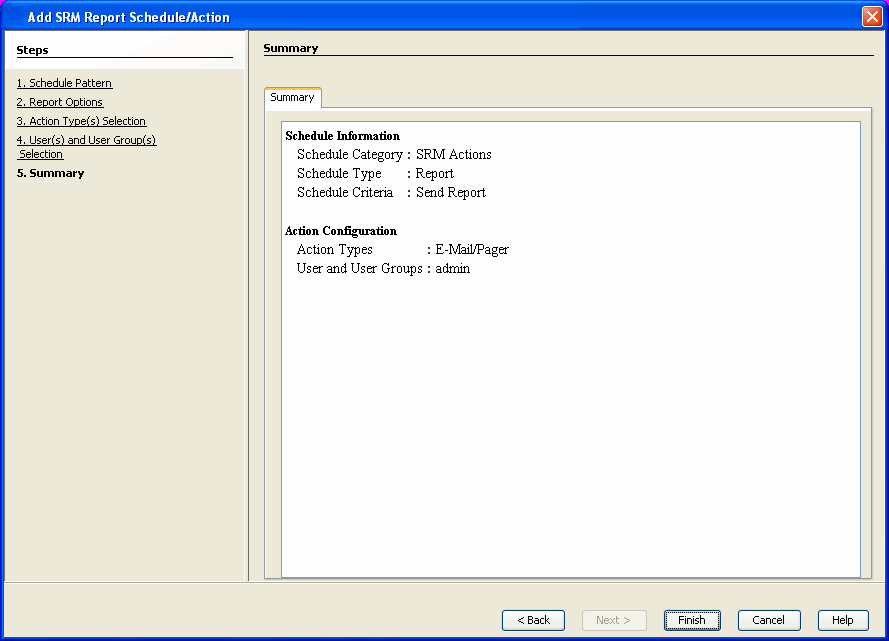
Configuring notifications is a step when scheduling a report. When
scheduled reports are run, notifications can be sent in the form of an email
or page, SNMP trap, RSS feed, Event Viewer message to inform email recipients, computers,
or a script that a report has run and is now available. The
possible notifications are explained in the sections below.
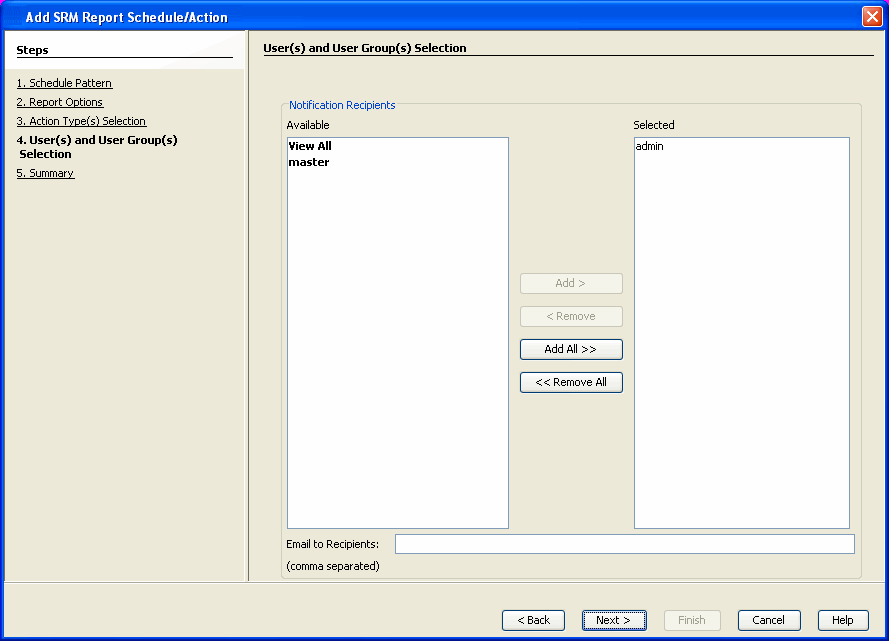
A notification can be sent to email or pager recipients when a scheduled
report has run. The recipient can be either a CommCell user, a CommCell user
group, a domain or external user (e.g., yahoo, gmail, etc.), or a pager address.
A notification can be e-mailed or sent to a pager to a selected list of recipients
when a scheduled report has run. The recipients can be either a
CommCell user, a CommCell user group, a domain or external user (e.g., yahoo, gmail,
etc.), or a pager address.
A notification can be sent by a CommServe, using the SNMP protocol, to other
computers in the form of SNMP traps when a scheduled report has run. This notification type requires that the
SNMP Enabler software must be installed on the CommServe computer. See
SNMP
Enablers
for more information.
A notification can be sent to a script when a
scheduled report has run. Once receiving the notification, the script can be
specified to run on the CommCell or a client computer. Arguments can be
specified for the script as well. You can also select an option to read and
archive a list of files and directories of a report if a supported Archiver
Agent is installed on the client computer and an On Demand Archive Set is
configured with SRM enabled.
A notification can be sent to run a Data Archiver operation when a
scheduled report has run. You can select an option to read and
archive a list of files and directories of a report if a supported Archiver
Agent is installed on the client computer and an On Demand Archive Set is
configured with SRM enabled. For the Data Archiver schedule to run successfully, archive rights on the client computer are required.
A notification can be sent in a Really Simple Syndication (RSS) feed when a
scheduled report has run. The RSS feed can be automatically integrated with your
Web Browser.
Forecasting is prediction of data usage in future, based on the usage pattern in the past. Since Prediction allows visualizing data usage in future, it helps make business decisions accordingly. Prediction is available on history reports and it can be done based on Daily/weekly/Monthly data. In the graphs, prediction lines are shown as thin lines while the actual usage is shown as thick lines.
Reports can be used as initial templates or customized by adding or removing columns in the templates or specifying additional Filter Criteria. The following reports support File level Drill Down:
The table below lists the available report templates and the categories and columns that can be selected to configure a customized report. The table also shows the job types that are supported by each report.
| Category/Column |
Description |
SRM Windows File System Agent |
| |
|
Discovery Job |
Discovery and Analysis Job |
Agentless SRM |
| |
|
|
|
|
| Client Properties |
Displays aspects of the client computer on which the SRM Windows File System Agent is installed. |
|
| Available Memory |
|
X |
|
|
| Available Memory Percentage |
|
X |
|
|
| CPU Utilization |
|
X |
|
|
| Free Disk Percentage |
|
X |
|
|
| Free Disk Space |
|
X |
|
|
| Hostname |
|
X |
|
|
| Memory |
|
X |
|
|
| Operating System |
|
X |
|
|
| OS Vendor |
|
X |
|
|
| OS Version |
|
X |
|
|
| Processors |
|
X |
|
|
| Service Pack |
|
X |
|
|
| SP Version |
|
X |
|
|
| Time Zone |
|
X |
|
|
| Total Disk Space |
|
X |
|
|
| Used Disk Percentage |
|
X |
|
|
| Used Disk Space |
|
X |
|
|
| Used Memory |
|
X |
|
|
| Used Memory Percentage |
|
X |
|
|
| Data Archive Return on Investment |
Displays the disk space saved and the cost saved by using an Archiver Agent. |
|
| Archived File Size |
|
|
X |
|
| Archived Space Saved |
|
|
X |
|
| Billable Entity |
|
|
X |
|
| Cost Saved |
|
|
X |
|
| Stub File Size |
|
|
X |
|
| Total Cost |
|
|
X |
|
| Total File Size |
|
|
X |
|
| Disk Details |
Displays aspects of physical disks (e.g., capacity, partitions, space, etc.). |
|
| Allocated Space |
|
X |
X |
X |
| Block Size |
|
X |
X |
X |
| Blocks |
|
X |
X |
X |
| Capacity |
|
X |
X |
X |
| Grown Defects |
|
X |
X |
|
| Manufacturer |
|
X |
X |
|
| Model |
|
X |
X |
X |
| Partitions |
|
X |
X |
X |
| Primary Defects |
|
X |
X |
X |
| Serial Number |
|
X |
X |
|
| Total Defects |
|
X |
X |
X |
| Unallocated Space |
|
X |
X |
X |
|
Disk History
|
Displays how physical disks have been used for a given time period. Useful for trending purposes and to identify disks that are likely to fail soon. |
|
| As Of |
|
X |
X |
|
| Grown Defects |
|
X |
X |
|
| Primary Defects |
|
X |
X |
|
| Total Defects |
|
X |
X |
|
|
File by Extensions
|
Displays aspects of each file per extension that is used and the number of files that include each file extension. |
|
| Average File Size |
|
X |
X |
|
| Extension |
|
X |
X |
|
| Files |
|
X |
X |
|
| Max File Size |
|
X |
X |
|
| Total File Size |
|
X |
X |
|
|
File Level Analytic
|
Displays deeper analysis of files. Selecting Analysis Job is required when running data collection job. |
|
| Access Time |
Displays last time file was used, e.g., 11/11/2009 17:14. |
|
|
|
| Computer |
Displays name of the local host, e.g., client1. |
|
|
|
| Creation Time |
Displays the time the file was originated, e.g., 1/19/2008 4:33. |
|
|
|
| Depth |
Displays the number of directories away from the root directory, e.g., 6. |
|
|
|
| Directory |
Displays the full path for a directory or file, e.g., C:\\Windows\\System32\\drivers\\etc. |
|
|
|
| Directory Count |
Displays the number of directories within a directory, e.g., 8. |
|
|
|
| Disk |
Displays the physical disk, e.g., \\.\PHYSICALDRIVE0. |
|
|
|
| Extension Name |
Displays the extension associated with the file, e.g., TXT. |
|
|
|
| File |
Displays actual name of the file, e.g., hosts. |
|
|
|
| File Count |
Displays the number of files in a directory, e.g., 32. |
|
|
|
| Modification Time |
Displays the last changed time, e.g., 9/18/2006 17:37. |
|
|
|
| Partition |
Displays the location of the directory/file on the physical disk, e.g., \\?\Volume{40c1a42b-ce5d-11de-aa5e-806e6f6e6963}\-5cddc2d7), Partition_1, Disk_0 |
|
|
|
| Size |
Displays the file or directory size (0 MB for directory), e.g., 90.19MB |
|
|
|
| Subclient |
Displays the subclient name, e.g., default. |
|
|
|
| Type |
Displays either the directory or file type, e.g., Directory. |
|
|
|
| User Group Name |
Displays the group to which the owner of the file(s) belong, e.g., Engineering. |
|
|
|
| User Name |
Displays the domain\owner of the file, e.g., BUILTIN\\Administrators. |
|
|
|
| Volume |
Displays the drive letter, e.g., C:\. |
|
|
|
|
File Level Analytic Directories
|
Displays deeper analysis of files. Selecting Analysis Job is required when running data collection job. |
|
| Computer |
|
|
|
|
| Directory |
|
|
|
|
| Directory Depth |
|
|
|
|
| Directory File Count |
|
|
|
|
| Directory Name |
|
|
|
|
| Directory Size |
|
|
|
|
| Group Name |
|
|
|
|
| Sub-directory Count |
|
|
|
|
| Total Directories |
|
|
|
|
| Total Files |
|
|
|
|
| User Name |
|
|
|
|
| Volume |
|
|
|
|
|
File Level Analytic Files
|
Displays deeper analysis of files. Selecting Analysis Job is required when running data collection job. |
|
| Access Time |
|
|
|
|
| Computer |
|
|
|
|
| Creation Time |
|
|
|
|
| Directory Path |
|
|
|
|
| Extension Name |
|
|
|
|
| File |
|
|
|
|
| Is Stub File |
|
|
|
|
| Modification Time |
|
|
|
|
| Size |
|
|
|
|
| Stub File Space Saved |
|
|
|
|
| User Group Name |
|
|
|
|
| User Group Name |
|
|
|
|
| Volume |
|
|
|
|
|
File Shares
|
Displays aspects of files that are shared in the network. |
|
| Allocated Space |
|
X |
X |
X |
| Free Space |
|
X |
X |
X |
| Owner |
|
X |
X |
X |
| Path Name |
|
X |
X |
X |
| Protocol |
|
X |
X |
X |
| Share Name |
|
X |
X |
X |
|
File System File Distribution by Access Time
|
Displays file statistics and average size of files, total file size, and type by access time. |
|
| Average File Size |
|
|
X |
|
| Files |
|
|
X |
|
| Total File Size |
|
|
X |
|
| Type |
|
|
X |
|
|
File System File Distribution by Modification Time
|
Displays file statistics and average size of files, total file size, and type by modification time. |
|
| Average File Size |
|
|
X |
|
| Files |
|
|
X |
|
| Total File Size |
|
|
X |
|
| Type |
|
|
X |
|
|
File System File Distribution by Size
|
Displays file statistics and average size of files, total file size, and type by size. |
|
| Average File Size |
|
|
X |
|
| Files |
|
|
X |
|
| Total File Size |
|
|
X |
|
| Type |
|
|
X |
|
|
File System File Distribution by Type
|
Displays file statistics and average size of files, total file size, and type by type. |
|
| Average File Size |
|
|
X |
|
| Files |
|
|
X |
|
| Total File Size |
|
|
X |
|
| Type |
|
|
X |
|
|
File System Usage
|
Displays file statistics and how the files are stored and organized in the file system. |
|
| Average File Size |
|
|
X |
|
| Average Files per Directory |
|
|
X |
|
| Average Tree Depth |
|
|
X |
|
| Compressed Files |
|
|
X |
|
| Directories |
|
|
X |
|
| Encrypted Files |
|
|
X |
|
| Files |
|
|
X |
|
| Max File Size |
|
|
X |
|
| Maximum Tree Depth |
|
|
X |
|
| Migrated Space Saved |
|
|
X |
|
| Sparse File Count |
|
|
X |
|
|
File System Usage History
|
Displays overall file system statistics. Useful for trending purposes. |
|
| As Of |
|
X |
X |
X |
| Percent Used |
|
X |
X |
X |
| Used Space |
|
X |
X |
X |
|
Installed Software
|
Summarizes software installed on Windows File System clients in the SRM cell. Useful for troubleshooting installation or licensing problems. |
|
| Package |
|
X |
X |
X |
| Vendor |
|
X |
X |
X |
| Version |
|
X |
X |
X |
|
Largest Files
|
Displays properties of largest files (e.g., name, owner, size). |
|
| Largest File Accessed |
|
X |
X |
X |
| Largest File Created |
|
X |
X |
X |
| Largest File Group |
|
X |
X |
X |
| Largest File Modified |
|
X |
X |
|
| Largest File Name |
|
X |
X |
|
| Largest File Owner |
|
X |
X |
|
| Largest File Size |
|
X |
X |
|
|
Least Recently Used Files
|
Displays properties of least recently used files (e.g., name, owner, size). |
|
| Least Recently Used File Accessed |
|
X |
X |
X |
| Least Recently Used File Created |
|
X |
X |
X |
| Least Recently Used File Group |
|
X |
X |
X |
| Least Recently Used File Modified |
|
X |
X |
|
| Least Recently Used File Name |
|
X |
X |
|
| Least Recently Used File Owner |
|
X |
X |
|
| Least Recently Used File Size |
|
X |
X |
|
|
Microsoft Exchange PST File
|
Displays aspects of PST (personal storage) files created by Microsoft Outlook. |
|
| Accessed |
|
|
X |
|
| Created |
|
|
X |
|
| Group |
|
|
X |
|
| Modified |
|
|
X |
|
| Name |
|
|
X |
|
| Owner |
|
|
X |
|
| Size |
|
|
X |
|
|
Oldest Files
|
Displays properties of oldest files (e.g., name, owner, size). |
|
| Oldest File Accessed |
|
X |
X |
X |
| Oldest File Created |
|
X |
X |
X |
| Oldest File Group |
|
X |
X |
X |
| Oldest File Modified |
|
X |
X |
|
| Oldest File Name |
|
X |
X |
|
| Oldest File Owner |
|
X |
X |
|
| Oldest File Size |
|
X |
X |
|
|
Partition Details
|
Summarizes aspects of each partition of the file system. |
|
| Blocks |
|
X |
X |
X |
| Capacity |
|
X |
X |
X |
| Type |
|
X |
X |
X |
|
Process Information
|
Displays aspects of the client computer on which the SRM Windows File System Agent is installed. |
|
| Base Priority |
|
X |
|
|
| CPU Time |
|
X |
|
|
| CPU Usage |
|
X |
|
|
| GDI Objects |
|
X |
|
|
| Handles |
|
X |
|
|
| Image Name |
|
X |
|
|
| IO Other |
|
X |
|
|
| IO Other Bytes |
|
X |
|
|
| IO Read Bytes |
|
X |
|
|
| IO Reads |
|
X |
|
|
| IO Write Bytes |
|
X |
|
|
| IO Writes |
|
X |
|
|
| Memory Usage |
|
X |
|
|
| Memory Usage Delta |
|
X |
|
|
| Non-paged Pool |
|
X |
|
|
| Page Faults |
|
X |
|
|
| Page Faults Delta |
|
X |
|
|
| Paged Pool |
|
X |
|
|
| Peak memory Usage |
|
X |
|
|
| PID |
|
X |
|
|
| Session ID |
|
X |
|
|
| Threads |
|
X |
|
|
| User Name |
|
X |
|
|
| User Objects |
|
X |
|
|
| Virtual Memory Size |
|
X |
|
|
|
Prohibited Files
|
Displays aspects of files that are not allowed (or forbidden) in the Windows file system. |
|
| Accessed |
|
|
X |
|
| Created |
|
|
X |
|
| Group |
|
|
X |
|
| Modified |
|
|
X |
|
| Name |
|
|
X |
|
| Owner |
|
|
X |
|
| Size |
|
|
X |
|
|
Services
|
Displays service names running on the client computer and their current state. |
|
| Log On |
|
X |
|
|
| Name |
|
X |
|
|
| Startup Type |
|
X |
|
|
| State |
|
X |
|
|
|
Software Activity
|
Displays activity such as when software packages was installed or removed and details of the software package. |
|
| Date |
|
X |
X |
X |
| Package Name |
|
X |
X |
X |
| Type |
|
X |
X |
X |
| Vendor Name |
|
X |
X |
X |
| Version |
|
X |
X |
X |
|
Software Instances
|
|
|
X |
|
| Instances |
|
X |
X |
X |
| Name |
|
X |
X |
X |
| Vendor |
|
X |
X |
X |
|
Subclient File Distribution by Access Time
|
Displays file statistics and average size of files per subclient, such as total file size, and type by access time. |
|
| Average File Size |
|
|
X |
|
| Files |
|
|
X |
|
| Total File Size |
|
|
X |
|
| Type |
|
|
X |
|
|
Subclient File Distribution by Modification Time
|
Displays file statistics and average size of files per subclient, such as total file size, and type by modification time. |
|
| Average File Size |
|
|
X |
|
| Files |
|
|
X |
|
| Total File Size |
|
|
X |
|
| Type |
|
|
X |
|
|
Subclient File Distribution by Size
|
Displays file statistics and average size of files per subclient, such as total file size, and type by size. |
|
| Average File Size |
|
|
X |
|
| Files |
|
|
X |
|
| Total File Size |
|
|
X |
|
| Type |
|
|
X |
|
|
Subclient File Distribution by Type
|
Displays file statistics and average size of files per subclient, such as total file size, and type by type. |
|
| Average File Size |
|
|
X |
|
| Files |
|
|
X |
|
| Total File Size |
|
|
X |
|
| Type |
|
|
X |
|
| Version |
|
X |
X |
X |
|
Subclient Usage
|
Displays Calypso subclient (the logical entity that uniquely defines a unit of data on a client computer) information. |
|
| Average File Size |
|
|
X |
|
| Average Files per Directory |
|
|
X |
|
| Average Tree Depth |
|
|
X |
|
| Compressed Files |
|
|
X |
|
| Directories |
|
|
X |
|
| Encrypted Files |
|
|
X |
|
| Files |
|
|
X |
|
| Maximum File Size |
|
|
X |
|
| Maximum Tree Depth |
|
|
X |
|
| Migrated Space Saved |
|
|
X |
|
| Sparse File Count |
|
|
X |
|
|
Total File System Usage by User
|
Displays file information by individual user. Useful to identify the major consumers of storage for capacity management and planning purposes. |
|
| Average File Size |
|
|
X |
|
| Files |
|
|
X |
|
| Max File Size |
|
|
X |
|
| Name |
|
|
X |
|
| Total File Size |
|
|
X |
|
|
User Group Violations
|
Displays disk space violations per user to help enforce corporate storage usage policies. |
|
| Disk Space Hard Limit |
|
X |
X |
X |
| Disk Space Soft Limit |
|
X |
X |
X |
| User Group Name |
|
X |
X |
X |
| Violation Used Disk Space |
|
X |
X |
X |
|
User Usage
|
Displays a summary of files used and their size (average, maximum, total) per user name. |
|
| Average File Size |
|
|
X |
|
| Files |
|
|
X |
|
| Maximum File Size |
|
|
X |
|
| Total File Size |
|
|
X |
|
| User Name |
|
|
X |
|
|
User Violations
|
Displays quota violations per user to help enforce corporate storage usage policies. FSRM columns report Windows 2008 R2 File System Resource Manager (FSRM) information. |
|
| Block Count Hard Limit |
|
X |
X |
X |
| Block Count Soft Limit |
|
X |
X |
X |
| FSRM Quota Path |
|
X |
X |
X |
| FSRM Quota Type |
|
X |
X |
X |
| FSRM Space Limit |
|
X |
X |
X |
| FSRM Template |
|
X |
X |
X |
| FSRM Used Block Count |
|
X |
X |
X |
| Used Block Count |
|
X |
X |
X |
| User Name |
|
X |
X |
X |
|
Volume Details
|
Displays aspects of each volume (a single accessible storage area with a single file system) to help identify heavy disk consumers for capacity management and planning purposes. |
|
| Free Space |
|
X |
X |
X |
| Percent Free |
|
X |
X |
X |
| Percent Used |
|
X |
X |
X |
| Total Space |
|
X |
X |
X |
| Type |
|
X |
X |
X |
| Used Space |
|
X |
X |
X |
|
Windows Entities
|
Displays overall aspects per each computer selected (e.g., computer name, host group, etc.). |
|
| Client Computer Group |
|
X |
X |
X |
| Computer |
|
X |
X |
X |
| Disk |
|
X |
X |
X |
| Partition |
|
X |
X |
X |
| Subclient |
|
|
X |
|
| Volume |
|
X |
X |
X |
Data for the Cost History and Usage History reports (e.g., Cost History by Application, Usage History by Application) is compiled at regular intervals by a background process on the SRM Server. The default interval is one week, which means the Cost History reports will show one data point per week, no matter how often data collection is scheduled for them; thus, data collection for these reports should be synchronized to the summary interval. You can configure the interval by selecting SRM
Options in the Control Panel.
For a newly installed SRM Server, no data will appear in these reports until either the default interval, or a user-specified interval has elapsed from the time of installation, at which time the first summary process will run, and data will be available for these reports.
