
| Overview | Setup | How To | Troubleshooting | Frequently Asked Questions (FAQ) |
|
Generating a Report with a Query
Adding Custom Reports to the Dashboard
Adding Saved Reports to the Dashboard
Changing a Report on the Dashboard
Opening the Chart in a New Window
Deleting a Report from the Dashboard
After the Dashboard site has been set up, any user who is configured in the name server directory can log into the site.
To log into the Dashboard site:
| 1. | Open a supported Web Browser. See Supported Web Browsers. | |
| 2. | In the address bar, enter the following URL: http://<Web_Client_Name>:<Apache_Port_No>/customreports where <Web_Client_Name> is the name of the Web client. <Apache_Port_No> is the Apache port number that is provided at the time of installing Web client. For example: http://rhode:80/customreports |
|
| 3. |
For subsequent logins, in the User Name box, enter the domain
name for the CommServe and your user name. For example: domain1\user1 In the Password box, enter your password, and then click Login. |
 |
| The Dashboard appears. |
 |
To build a custom report query:
| 1. | Log into the Dashboard site. For instructions, see Accessing Dashboard. | |
| 2. | At the top of the page, click Custom Reports. |
|
| 3. |
Click the Build Report tab. |
 |
| 4. |
From the Select CommCell list, click the name of a CommCell. |
|
| 5. |
By default, the report uses the CommServe database. To change the database, from the Select Database list, click the name of a database. |
|
| 6. |
By default, the report uses Tables from the selected database. To change the selection to Views, in the New Report area, click the Select Table down arrow and select View. Tables indicate particular tables in the database, while Views indicate a group of tables in the database. |
|
| 7. |
Next to Select Table/Select View, select the table or view for which you want to generate the report from the drop-down list, and then click Select Columns. |
|
| 8. |
From the Select Columns list, select the column headings that you want to include in the report. |
|
| 9. |
Click View Data. The report information that you selected appears in a table at the bottom of the page. |
|
| 10. |
To generate a bar chart to the report, click Bar. If the data is not sufficient to create a bar chart, a dialog box appears that asks you to select data to appear in the chart:
|
 |
| 11. |
To generate a pie chart to the report, click Pie. If the data is not sufficient to create a pie chart, a dialog box appears that asks you to select data to appear in the chart:
|
 |
To generate a custom report from with a query:
| 1. | Log into the Dashboard site. For instructions, see Accessing Dashboard. | |
| 2. | At the top of the page, click Custom Reports. |
|
| 3. | Click the Build Report tab. |
 |
| 4. | In the New Report section, enter a report query in the box. | |
| 5. | Click View Data. | |
| 6. | To generate a bar chart to the report, click Bar. |
 |
| 7. | To generate a pie chart to the report, click Pie. |
 |
Once you configure a report query, you can save it and use it again for any available CommCell.
To save a report query:
| 1. | Build a custom report. For instructions, see Building a Report. | |
| 2. | In the New Report section, click Save. The Save Query dialog box appears. |
 |
| 3. | In the Report Name box, enter a name for the
report query, and then click Save. A message appears at the top of the page that says the view saved successfully. |
|
| 4. | Click the X button to close the message. |
|
| 5. | To verify that your report saved to the list, click the
View Report tab. The name of the report that you just saved appears in the Select Report box. |
 |
To run a previously saved custom report:
| 1. | Log into the Dashboard site. For instructions, see Accessing Dashboard. | |
| 2. | At the top of the page, click Custom Reports. |
|
| 3. |
Click the View Report tab. |
 |
| 4. |
From the Select Report list, click the name of a previously saved report. |
|
| 5. |
From the Select CommCell list, click the name of the CommCell on which you want to run the report. |
|
| 6. | From the Select Database list, click the name of the database on which you want to run the report. | |
| 7. |
Click View Data. |
|
| 8. |
To generate a bar chart to the report, click Bar. |
 |
| 9. |
To generate a pie chart to the report, click Pie. |
 |
You can save custom reports to the dashboard, so that you view and interact with them when you first log in.
| 1. | View a custom report. For instructions, see Viewing a Report. | |
| 2. |
At the top of the chart, click Add To Dashboard. The report is added the dashboard. |
 |
The following table describes additional operations that you can perform with this feature:
| Option | Description |
| Filtering Report Data by Column | To filter report data by column:
|
| Filtering Report Data with Find Records | To filter report data with Find Records:
|
| Opening the Chart in a New Window | You can generate a Web address for the chart, so that
you can use it on a Web page or in an application. To view the Web address for the chart:
|
| Exporting a Report | To export a report to Microsoft Excel:
|
| Changing a Saved Report | To change the settings for a saved report query:
|
| Changing a Chart | To change the settings for a pie or bar chart:
|
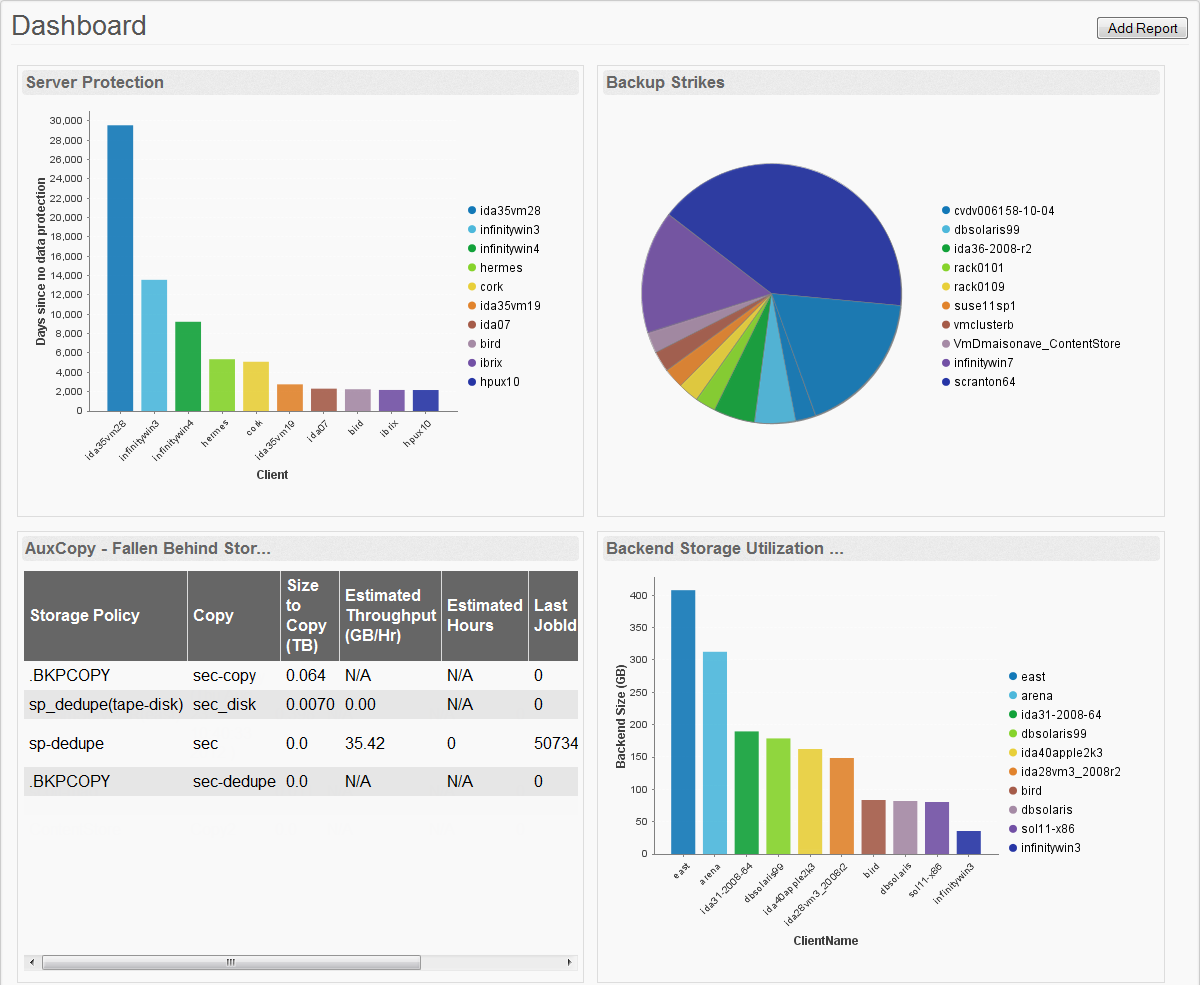
The Dashboard displays a preview of custom reports. Some reports are displayed by default, but you can change them, replace them, or add other custom reports that you create, depending on your needs.
You can add previously saved reports to the Dashboard.
To add saved reports to the Dashboard:
| 1. | Log into the Dashboard site. For instructions, see Accessing Dashboard. |
 |
| 2. | At the top of the Dashboard, click Add Report. Optionally, you can click the Add Report box at the bottom of the page. The Add Report Information dialog box appears. |
|
| 3. | From the Saved Reports box, select the name of a saved report. | |
| 4. | From the Chart Type box, select the type of chart that you want to display in the report. | |
| 5. | Click Apply. |
| 1. | Log into the Dashboard site. For instructions, see Accessing Dashboard. |
 |
| 2. |
Next to the title of the report that you want to change, click
the Edit Report Information button. The Edit Report Information dialog box appears. |
|
| 3. |
Perform any of the following operations:
|
|
| 4. |
Click Apply. Your changes to the report appear on the dashboard. |
To view the chart in a separate window and get the Web address for the chart:
| 1. | Log into the Dashboard site. For instructions, see Accessing Dashboard. |
 |
| 2. |
Next to the title of the report that you want to change, click
the Open in a new window button. The chart appears in a separate tab in your Web browser. You can use this Web address as a link to the chart. |
| 1. | Log into the Dashboard site. For instructions, see Accessing Dashboard. |
 |
| 2. |
Next to the title of the report that you want to change, click
the Delete Report button. The report is removed from the dashboard. |
|
|